
In today’s competitive landscape, accurately measuring market success is paramount. Businesses that fail to effectively track and analyze key performance indicators (KPIs) risk losing ground to rivals and missing crucial opportunities for growth. This article will explore eight essential metrics to help you accurately gauge your market success and make data-driven decisions that propel your business forward. Understanding these metrics and their implications is the first step towards achieving sustainable growth and a strong market position. We’ll delve into each metric, explaining its significance and how it contributes to a comprehensive understanding of your market performance. From market share and customer acquisition cost to customer lifetime value and brand awareness, this guide will provide you with the tools you need to assess your market success.
Measuring market success isn’t about vanity metrics; it’s about gaining actionable insights that inform strategic decision-making. Whether you are a startup seeking to establish a foothold or an established enterprise aiming to maintain market leadership, tracking the right metrics is crucial. By examining these eight key metrics, you can identify areas of strength, pinpoint weaknesses, and uncover hidden opportunities for improvement. This article will provide a clear framework for understanding and utilizing these metrics, ultimately empowering you to enhance your market performance and achieve your business objectives. This knowledge will enable you to optimize your strategies, allocate resources effectively, and ultimately drive market success.
Customer Acquisition Cost (CAC)
Customer Acquisition Cost (CAC) refers to the total cost a business incurs to acquire a new customer. This metric is crucial for understanding the efficiency of your marketing and sales efforts.
Calculating CAC involves dividing the total costs associated with acquiring new customers (marketing expenses, sales salaries, etc.) by the number of customers acquired within a specific period.
A high CAC can indicate inefficient spending, while a low CAC suggests effective acquisition strategies. Monitoring CAC helps businesses optimize their marketing budget and improve their overall profitability. It’s important to compare your CAC against your customer lifetime value (CLTV) to ensure sustainable growth. A healthy business typically maintains a CLTV significantly higher than its CAC.
Calculating CAC
A simplified formula for calculating CAC:
CAC = Total Marketing & Sales Costs / Number of New Customers AcquiredCustomer Lifetime Value (CLV)
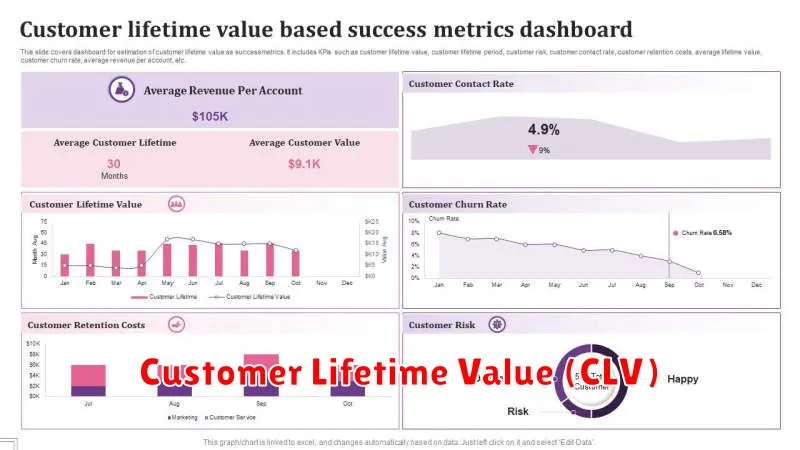
Customer Lifetime Value (CLV) represents the total revenue a business can reasonably expect from a single customer throughout their entire relationship. Understanding CLV is crucial for making informed decisions about sales, marketing, product development, and customer support.
A higher CLV indicates stronger customer relationships and more efficient business practices. By focusing on increasing CLV, businesses can prioritize strategies that foster long-term customer loyalty and maximize profitability.
Calculating CLV involves considering factors such as customer acquisition cost, average purchase value, and purchase frequency. A simplified formula for calculating CLV is:
Average Purchase Value * Average Purchase Frequency * Average Customer Lifespan
Example: If a customer spends an average of $50 per purchase, makes 4 purchases per year, and remains a customer for 3 years, their CLV is $600.
Conversion Rate Analysis
Conversion rate is a crucial metric that reveals the effectiveness of your marketing efforts in turning prospects into paying customers. It signifies the percentage of visitors or leads who complete a desired action, whether it’s making a purchase, signing up for a newsletter, or downloading a resource.
Calculating your conversion rate is straightforward: divide the number of conversions by the total number of visitors or leads and multiply by 100. For instance, if your website had 10,000 visitors and 200 made a purchase, your conversion rate is 2%.
Analyzing conversion rates helps identify areas for improvement in your sales funnel. A low conversion rate might indicate issues with website usability, pricing strategy, or the effectiveness of your calls to action. By monitoring and optimizing your conversion rate, you can significantly impact your bottom line.
Return on Investment (ROI)

Return on Investment (ROI) is a crucial metric for evaluating the profitability of your marketing campaigns. It measures the return you receive for every dollar invested.
Calculating ROI involves subtracting your marketing costs from the revenue generated by your marketing efforts, then dividing that figure by your marketing costs. Expressing this as a percentage provides a clear picture of your campaign’s profitability.
A positive ROI indicates that your campaign is generating profit, while a negative ROI signifies a loss. Tracking ROI helps you optimize your marketing spend and prioritize successful strategies.
Website Traffic Metrics
Website traffic metrics offer valuable insights into your online presence and marketing effectiveness. Tracking these metrics helps you understand user behavior, identify areas for improvement, and ultimately, drive more conversions.
Key metrics to monitor include:
- Unique Visitors: The number of individual users visiting your website within a specific timeframe. This metric helps you understand the reach of your marketing efforts.
- Page Views: The total number of pages viewed on your website. A high number of page views can indicate engaging content and effective website navigation.
- Bounce Rate: The percentage of visitors who leave your website after viewing only one page. A high bounce rate can signal issues with website design, content relevance, or user experience.
- Average Session Duration: The average amount of time users spend on your website per visit. Longer session durations suggest higher engagement with your content.
- Traffic Sources: Identifying where your traffic originates (e.g., organic search, social media, referrals) allows you to optimize your marketing strategies for each channel.
Social Media Engagement Rates
Social media engagement demonstrates how effectively you interact with your audience. It measures how often users actively participate with your content through likes, comments, shares, and saves. Tracking these metrics helps you understand your content’s resonance and audience interest.
Calculating engagement rates requires dividing the total number of engagements (likes, comments, shares, saves) by your total reach or impressions and then multiplying by 100 to express it as a percentage.
Different platforms may emphasize specific engagement actions. For example, retweets on X (formerly Twitter) are more critical than likes. Adjust your analysis based on each platform’s unique features.
A higher engagement rate typically indicates higher audience satisfaction and content relevance. This, in turn, can positively influence brand visibility and organic reach.
Customer Retention Rates
Customer Retention Rate (CRR) measures the percentage of customers a business retains over a specific period. A high CRR indicates strong customer loyalty and effective business strategies. This metric is crucial for sustainable growth, as retaining existing customers is often more cost-effective than acquiring new ones.
Calculating CRR involves comparing the number of customers at the end of a period to the number at the beginning, accounting for new customers acquired during that period. A simple formula is:
((CE - CN)/CS) * 100 = CRRWhere:
- CE = Number of customers at the end of the period
- CN = Number of new customers acquired during the period
- CS = Number of customers at the start of the period
Tracking CRR helps identify trends in customer behavior and allows businesses to adjust strategies to improve customer satisfaction and loyalty.
Net Promoter Score (NPS)
The Net Promoter Score (NPS) gauges customer loyalty and satisfaction by asking a simple question: “On a scale of 0 to 10, how likely are you to recommend our company/product/service to a friend or colleague?”.
Respondents are categorized into three groups:
- Promoters (9-10): Loyal enthusiasts who will likely fuel growth.
- Passives (7-8): Satisfied but not enthusiastic customers who are susceptible to competitive offerings.
- Detractors (0-6): Unhappy customers who can damage your brand through negative word-of-mouth.
The NPS is calculated by subtracting the percentage of Detractors from the percentage of Promoters. A positive NPS is generally considered good, while a high NPS (above 50) is excellent.
Tracking NPS over time helps identify trends in customer satisfaction and the impact of business decisions on customer loyalty.